Debugging
When developing applications in WaveMaker, there may be times when the app does not behave as expected or shows errors that are hard to diagnose. Debugging helps you investigate and fix such problems. WaveMaker supports debugging through logs, browser JavaScript debugging, and can also assist with diagnosing issues in deployed applications.
Debugging Using Logs
WaveMaker records log files that provide insight into what is happening in the design and runtime layers.
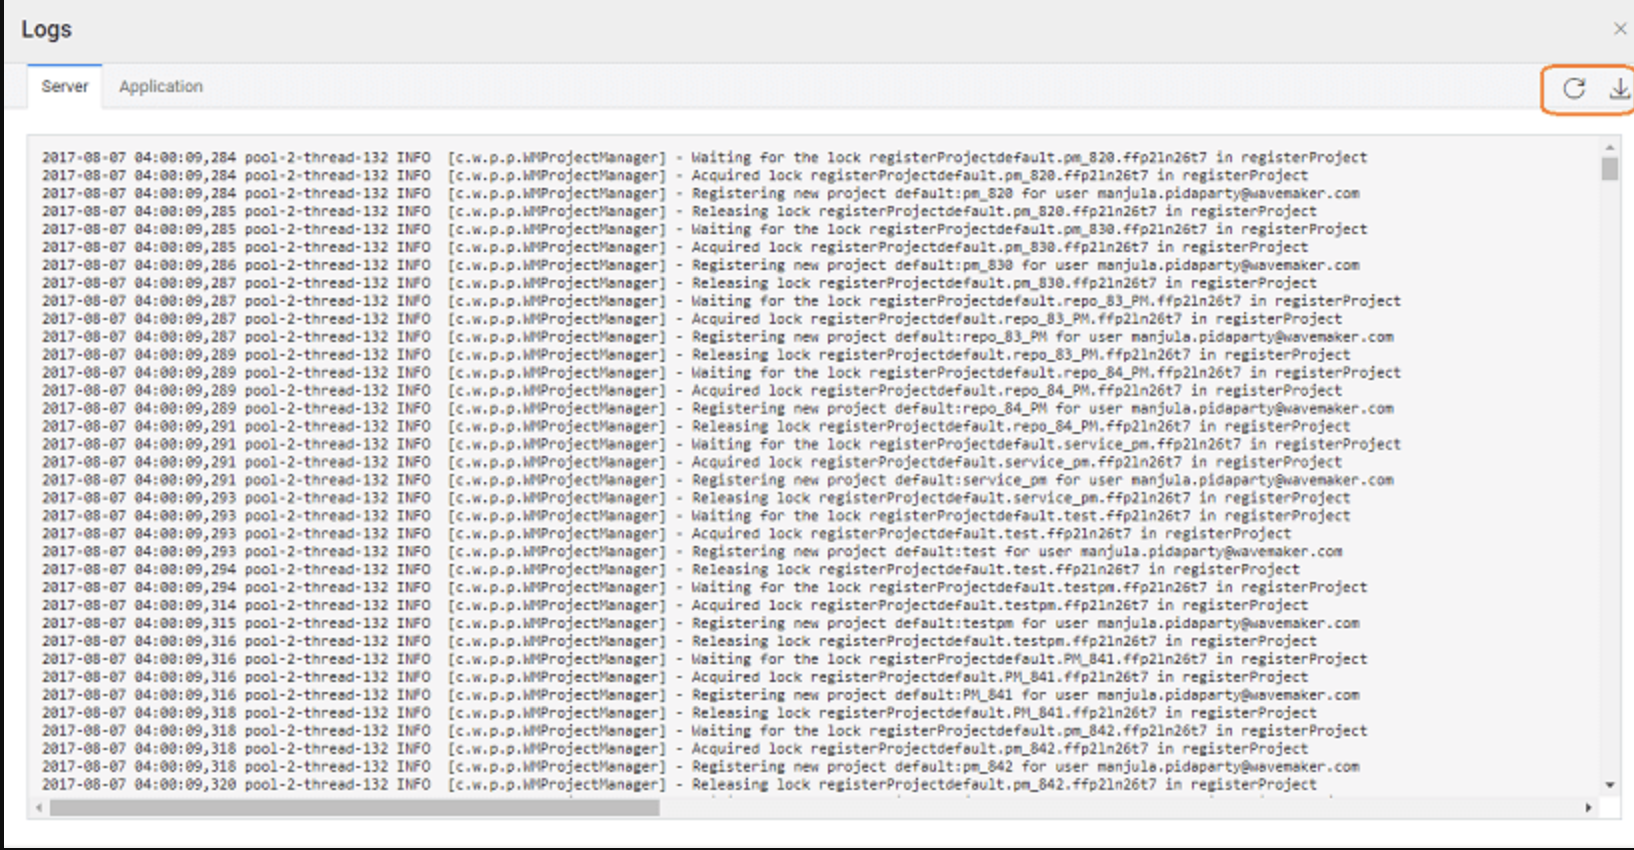
- Server Logs contain backend messages from the WaveMaker platform during development. These are especially useful when errors occur while importing or updating database schemas, or when backend services fail. For example, if a database import fails, the stack trace and root cause are captured in the server logs.
- Application Logs capture output from your application while it runs, helping you trace execution and review backend behavior during app usage.
You can access both types of logs from the footer area of the project workspace. The logs panel also includes a download icon so you can save logs locally for offline review, sharing with teammates, or submitting to support for deeper analysis.
Debugging with HAR Files
In some cases, especially when debugging network issues, the WaveMaker support team may request a HAR (HTTP Archive) file. HAR files capture network traffic and headers for a page session and are useful for diagnosing API or service call issues.
Steps to generate a HAR file:
- Open your running application in the browser.
- Open Developer Tools (e.g., in Chrome, press
Ctrl + Shift + I). - Go to the Network tab and enable Preserve Log to capture activity across navigations.
- Refresh the page.
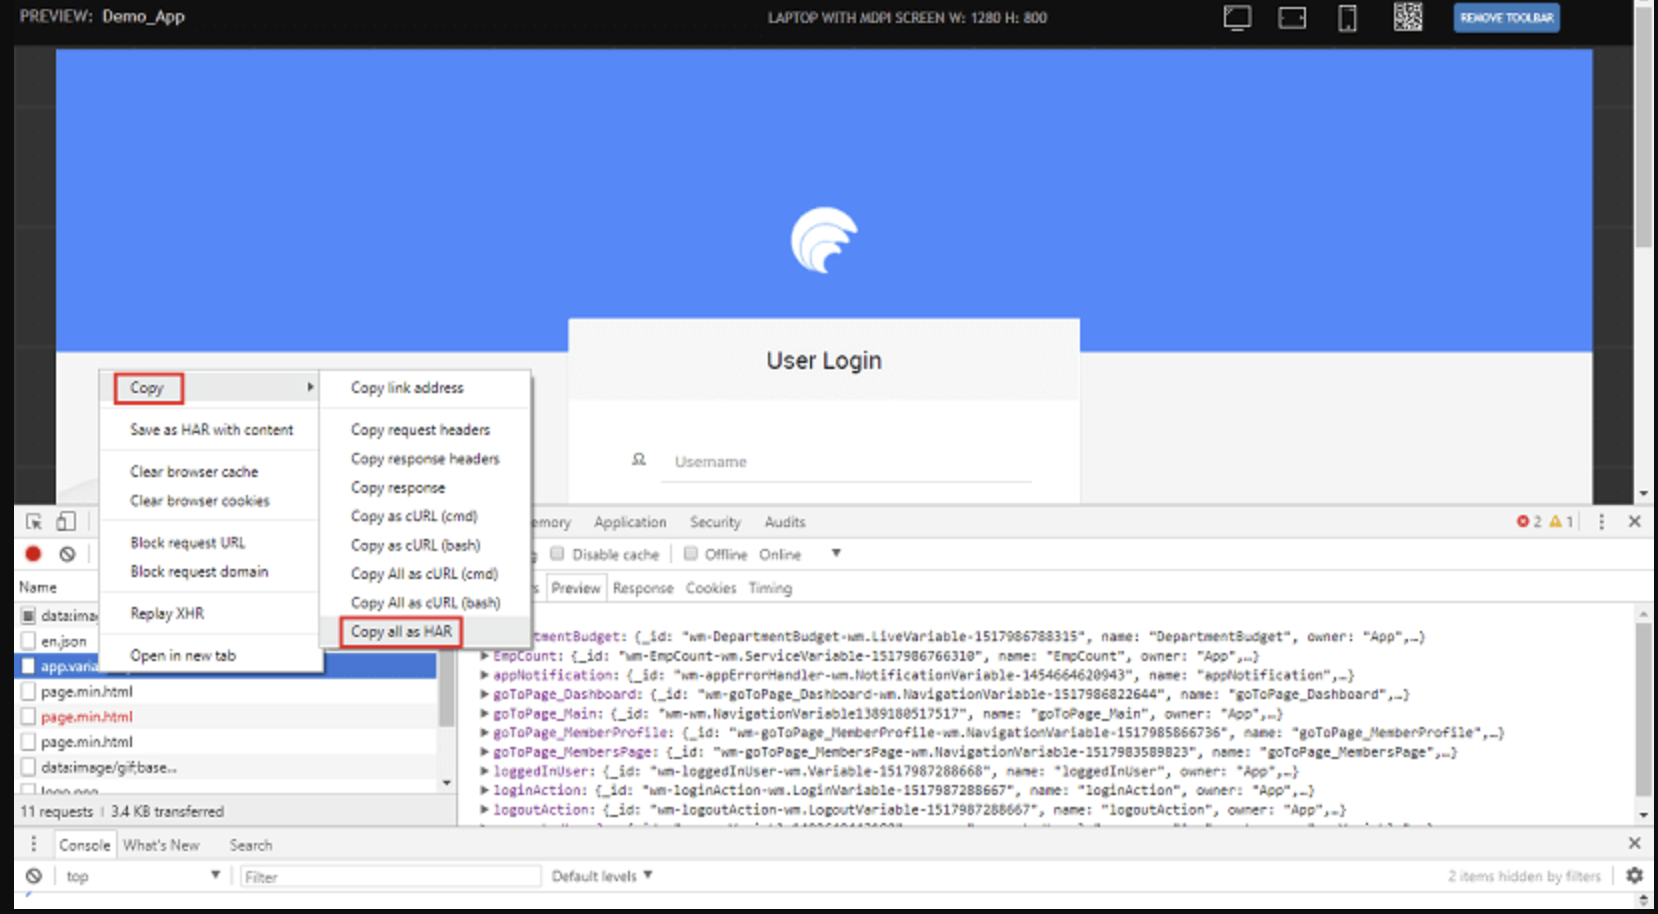
- Right-click on any network request and choose Copy → Copy all as HAR.
- Paste the copied content into a text editor and save it as a
.harfile. - Share the
.harfile with the support team along with the name of the failing service.
Printing Logger Statements in WaveMaker
Logs are records of events or activities within an application. They are essential for debugging, monitoring, and understanding application behavior. WaveMaker uses the SLF4J (Simple Logging Facade for Java) framework, which provides a consistent logging API that works with different underlying logging implementations such as Logback or Log4j2. SLF4J decouples your code from any specific logging library, making it easy to configure or switch logging frameworks based on your needs.
Add Logger Support
To print logging statements from a Java Service, you need to import the required SLF4J classes:
import org.slf4j.Logger;
import org.slf4j.LoggerFactory;
Next, declare a logger object in your Java Service class:
private static final Logger logger = LoggerFactory.getLogger(MyJavaService.class);
This creates a logger instance tied to your service class that can be used to record messages at different log levels.
Printing Log Messages
Once the logger is set up, you can use it to write log entries at various levels (DEBUG, INFO, WARN, ERROR, etc.). There are two primary ways to ensure your log statements appear in the log output:
1. Configure log4j2.xml
The logging configuration in WaveMaker is controlled by the log4j2.xml file. To enable detailed logging for your specific service:
- Open the
log4j2.xmlfile in your project. - Add a logger entry using your service's package and class name, for example:
<logger name="com.example.MyJavaService" level="DEBUG"/>
This tells the logging framework to record DEBUG-level (and above) messages for that service class. Without this, only higher-level messages (INFO and above) may be logged by default.
2. Adjust Log Level in Code
By default, the generated log4j2.xml sets the root log level to INFO. If your service logger uses DEBUG but nothing appears in the logs, update your log statement to a level that matches or exceeds the current configuration:
logger.info("This is an informational message");
Switching from logger.debug(...) to logger.info(...) ensures the message is recorded without adjusting the configuration file.
Key Points
- SLF4J provides a flexible logging API independent of the logging implementation.
- Use proper log levels (DEBUG, INFO, WARN, ERROR) to capture appropriate detail.
- Adjusting
log4j2.xmlenables you to control logging verbosity for specific classes. - Logging inside Java Services aids in debugging, monitoring execution paths, and tracing issues.
Logging effectively makes it easier to diagnose problems and understand application behavior during development and in production.
Debugging Deployed Applications
If issues occur after deployment, you can still retrieve logs to investigate what went wrong in a deployed environment:
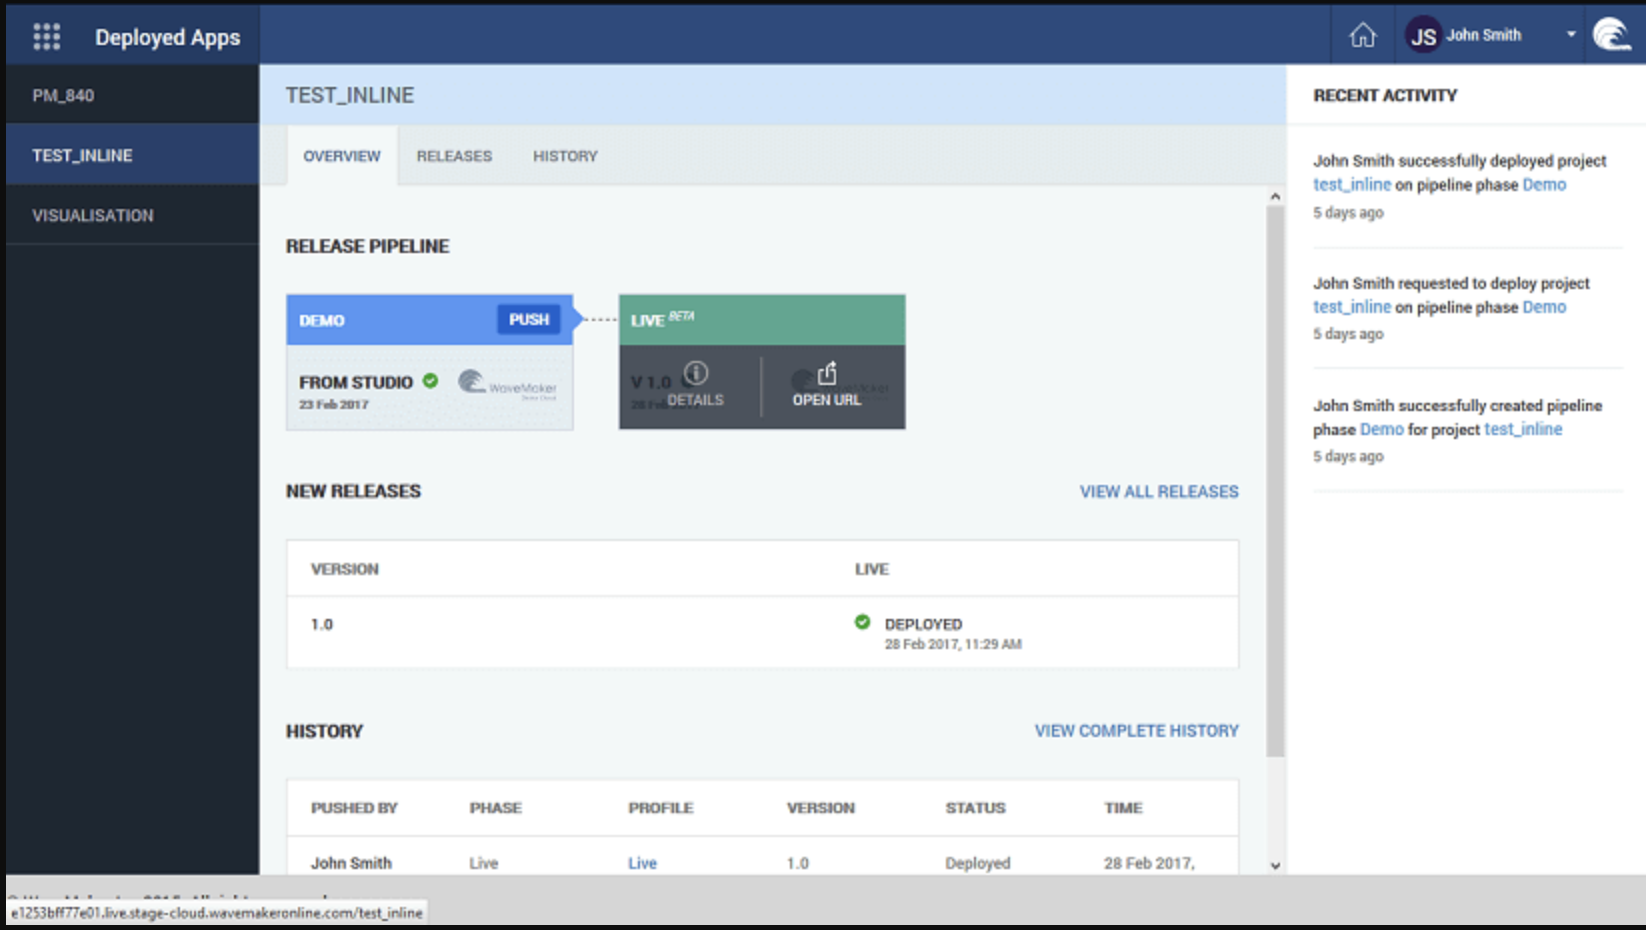
- Open the Apps Portal via the Manage Deployed Apps button in the Project Dashboard, or through Deploy → Manage App from the main menu.
- Select the deployment phase for which you need logs and choose Details.
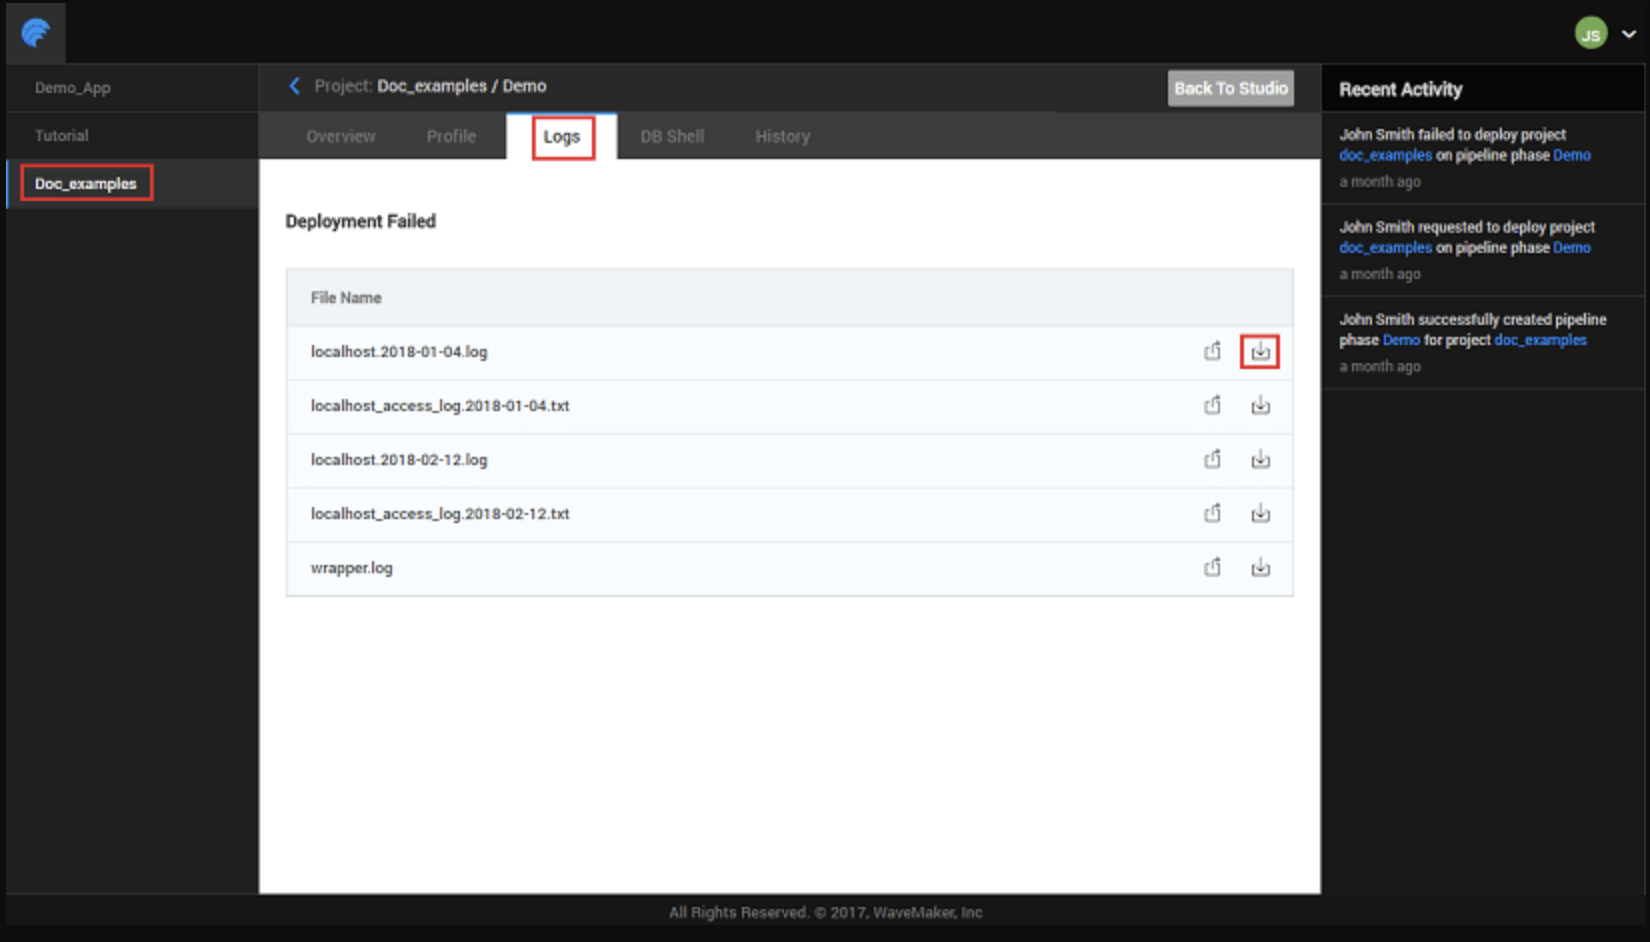
- Navigate to the Logs tab and use the download icon to retrieve log files for that deployment.
This enables detailed analysis of errors encountered by users in production or staging environments.
Summary
WaveMaker provides several tools to diagnose and resolve issues:
- Logs — Access server and application logs to understand backend activity and errors.
- Logger Statements — Use SLF4J logging framework to print custom log messages from Java Services with configurable log levels.
- HAR Files — Capture and export network traffic for deep debugging of API/service interactions.
- Deployed Application Logs — Retrieve logs for apps already deployed to understand runtime issues outside the development environment.
Using these debugging techniques together helps you quickly root-cause errors and ensure your WaveMaker application behaves as designed.
How-To Guides
Learn more about debugging through these practical guides:
- Debug Performance Issues using Fusion Reactor - Learn how to setup Fusion Reactor tool for WaveMaker Application Performance Monitoring